Benchmarking 2022: The Essential, Updated Digital Marketing Statistics You NEED to Know
Is your marketing strategy built on a false foundation? The internet is a rich source of data for digital marketers. But where does it come from? Do the marketing stats that search engines surface reflect the true state of marketing today? Or are they stale statistics warmed-over and repeated…

Is your marketing strategy built on a false foundation?
The internet is a rich source of data for digital marketers. But where does it come from?
Do the marketing stats that search engines surface reflect the true state of marketing today? Or are they stale statistics warmed-over and repeated until their original source and meaning has been lost?
To make data-driven decisions, digital marketers need fresh information.
That’s why we’ve put together a list of digital marketing statistics taken exclusively from reports generated within the past two years.
Of course, the nature of digital marketing and the current global situation mean that much has changed since some of these reports were written. Nonetheless, these statistics offer you the closest look at the state of marketing today to help guide your strategy for tomorrow.
Essential Digital Marketing Statistics
Don’t want to go through the entire thing? We’ve compiled the most jaw-dropping digital marketing statistics of the last two years from this list right in this section for you to have a quick glance at how the market is changing.
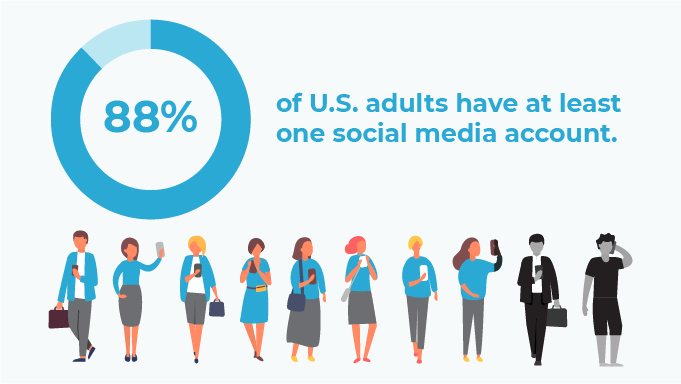
- Almost everyone is on social media now. 88% of U.S. adults have at least one social media account. (Oracle survey, 2019)
- Asking questions in the SERPs can give you an edge. Title tags that contain a question have a 14.1% higher click-through rate than those that do not. (Backlinko data analysis, 2019)
- SEO and link building remain an under-utilized strategy. Despite the fact that 77% of adult internet users report using Google 3 or more times a day to find things online (Moz survey, 2019), 90.63% of web pages receive no organic traffic from Google (Ahrefs data analysis, 2020).
- Fewer people are opening their personal emails – but there are strategies to improve that. Even though email users open just 57% of their personal emails and 80% of their work emails (Adobe survey, 2019), the open rate for triggered emails was 65.7% higher than the open rate for business as usual (BAU) emails. (Epsilon data analysis, 2019)
- Ads are becoming more expensive and less effective. 74% of consumers use at least 1 advertising avoidance strategy, such as an ad blocker (Edelman survey, 2019), and 77% of consumers don’t trust ads on social media. (Oracle survey, 2019)
- Smart devices are becoming much more widely accepted. 69% of global consumers used a digital assistant and 45% owned a smart speaker in 2018 or 2019. (Microsoft survey, 2019)
These stats are just the tip of the iceberg! Keep reading to find out more.
Social Media Statistics
Social media continued to gain influence in the lives of the average consumer in 2019. People look to social media to connect with friends, be entertained, and to shop. A growing percentage of consumers also rely on social media to find news and other critical information.
Social Media Is a Growing Influence in the Lives of Consumers
- Global social media use grew by 9.2% between January 2019 and January 2020. Currently, 49% of the world’s population (3.8 billion people) and 84% of all internet users use social media. (We are social, 2020)
- 88% of U.S. adults have at least one social media account. (Oracle survey, 2019)
- 74% of U.S. adult Facebook users visit the site daily. (Pew Research Center survey, 2019)
- 56% of U.S. adults get news from social media, 28% do so “often.” (Pew Research Center survey, 2019)
And Their Buyer’s Journey
- 68% of U.S. Gen Z and Millennial social media users find new products or services via social media channels at least once a month. (Oracle survey, 2019)
- 45% U.S. healthcare consumers use Facebook, 29% use Instagram, and 21% use Twitter to find or evaluate doctors. (Binary Fountain survey, 2019)
- 36% of global consumers have spent money through a social media ad. 41% of consumers have been influenced by ads on social media. (Selligent survey, 2019)
- 42% of global consumers say social media ads are somewhat annoying. (Selligent survey, 2019)
Content Marketing Statistics
The events of 2020 have put content marketing at center stage. Both B2B and B2C brands are employing a variety of formats and distribution channels to reach their audiences.
Top Performing Content for B2B
- 31% of B2B marketers say that blog posts and short articles were the best types of content for building brand awareness. 25% named social media as their top brand awareness medium. (MarketingProfs/Content Marketing Institute survey, 2020)
- 25% of B2B marketers say in-person events performed best at generating leads. 23% of B2B marketers said case studies provided the best lead conversion rates. (MarketingProfs/Content Marketing Institute survey, 2020)
When It Comes to Word Count, More Is Better, but How Much More?
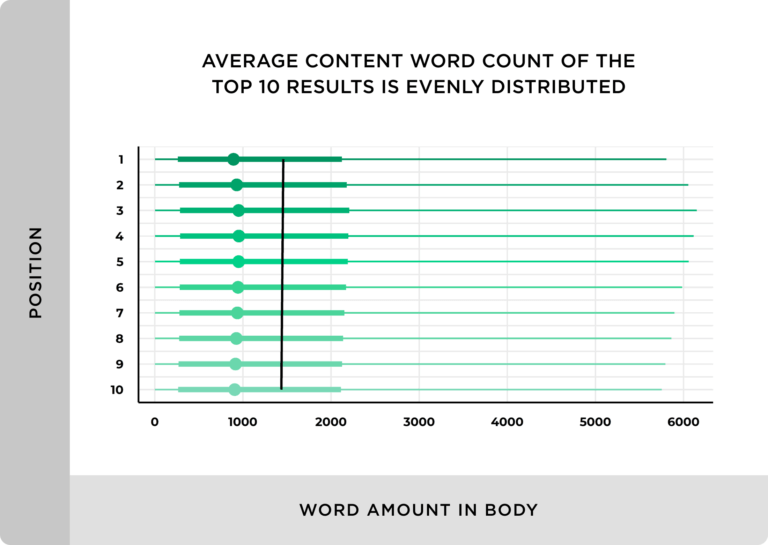
- The average word count for content appearing on the first page of Google’s SERPs in Q1 of 2020 was 1,447 words. (Backlinko data analysis, 2020)
- The 50 blog posts on Hubspot that performed best in organic search had word counts of between 2,100 and 2,400 words. (Hubspot data analysis, 2020)
- Blogs greater than 3,000 words long receive 3x more traffic, 4x more social shares, and 3.5x more backlinks than blogs of average length (901 to 1200 words). (SEMRush data analysis, 2019)
Crafting Click-Worthy Titles
- Headlines with 14 or more words had 222 average monthly page views, compared to 47 average monthly page views for blog posts with headlines of 6 words or less. (SEMRush data analysis, 2019)
- The click-through rate (CTR) of headlines between 15 and 40 characters long was 8.6% higher than the CTR of titles outside this range. (Backlinko data analysis, 2019)
- Title tags that contain a question have a 14.1% higher click-through rate than those that do not. (Backlinko data analysis, 2019)
Distribution Remains a Challenge
- 90.63% of web pages receive no organic traffic from Google and an additional 5.29% receive ten or fewer visits per month. (Ahrefs data analysis, 2020)
- 84% of B2B marketers used paid distribution channels to promote their content in 2019. (MarketingProfs/Content Marketing Institute survey, 2020)
Text Isn’t the Only Kind of Content
- 50% of shoppers say images help them decide what to buy and 53% say images have inspired them to make a purchase. (Think With Google survey, 2019)
- The amount of time consumers spend watching vehicle test drive videos on mobile grew by more than 70% between 2017 and 2019. (Think With Google data analysis, 2019)
- 87% of businesses used video as a marketing tool in 2019. (Wyzowl survey, 2020)
- The Trader Joe branded podcast is ranked among the top 1% of podcasts, and each episode averages 35,000 downloads within the first 30 days of its release. (AdAge, 2019)
SEO Statistics
Driven by algorithm updates and changes in consumer behavior, SEO statistics are seldom static. To keep you up-to-date, here are some of the most recent data points driving SEO strategy.
Searcher Behavior and SEO
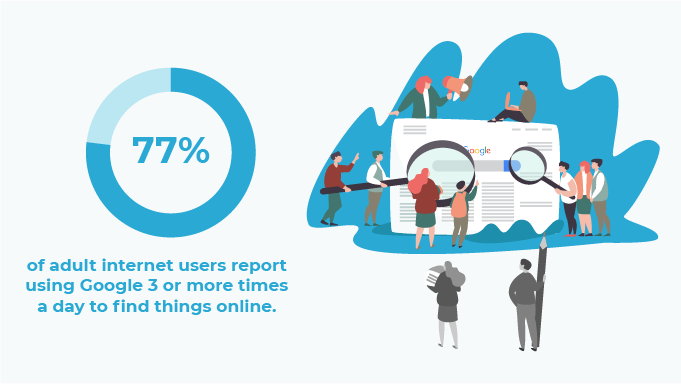
- 77% of adult internet users report using Google 3 or more times a day to find things online. (Moz survey, 2019)
- 99.84% of searches are for long-tail (low volume) keywords that receive fewer than 1,000 searches per month. These searches account for 39.33% of all search volume. (Ahrefs data analysis, 2019)
- 75% of adult internet users say they stick to page one search results to find answers to their search queries. (Moz survey, 2019)
- 31.7% of all click-throughs go to the link in position one of Google’s search results. (Backlinko data analysis, 2019)
Is Link Building an Underutilized Strategy?
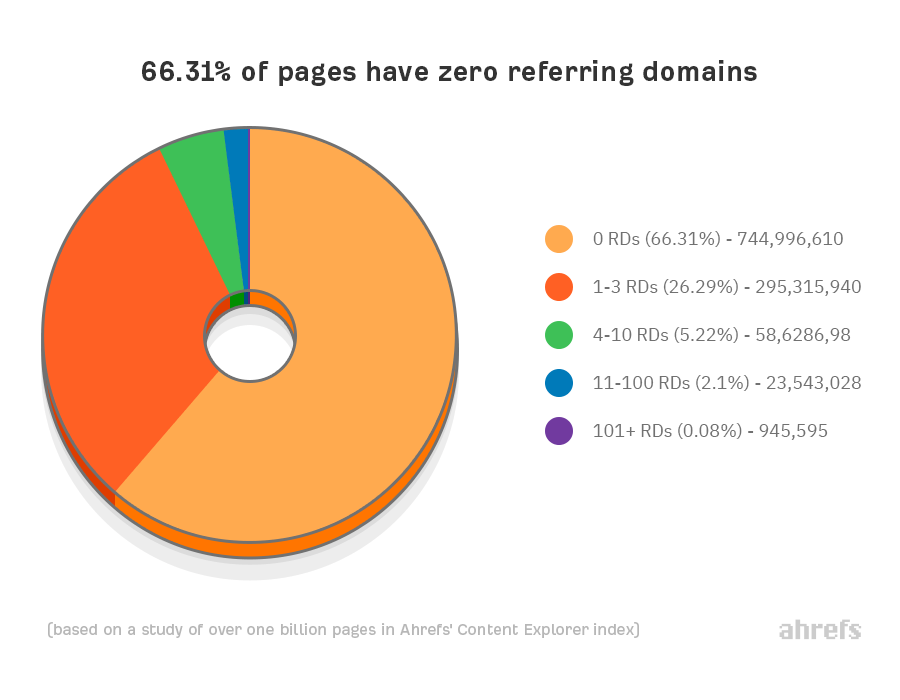
- 66.31% of web pages have no referring domains (backlinks). 26.29% of pages have one to three backlinks. That means just 7.4% of web pages have more than 3 backlinks. (Ahrefs data analysis, 2020)
- 75% of digital marketers use content marketing to generate backlinks. (Aira survey, 2020)
Local SEO in Pre-Pandemic Times
- 97% of U.S. consumers ages 18 to 37 do online research before they visit a store. (BRP Consulting survey, 2019)
- 33% of U.S. consumers used online search engines to find local businesses daily and 70% searched local at least once a month in 2019. (BrightLocal survey and data analysis, 2019)
- 84% of local businesses with Google My Business listings are found via discovery (non-branded) searches. 34% of local businesses are surfaced in more than 1,000 discovery search results each month. (BrightLocal data analysis, 2019)
- Third-party directory Yelp appears in the top 5 results for 92% of local discovery queries (keyword + city). (Fresh Chalk data analysis, 2019)
Email Marketing Statistics
Email overload has become such a problem in recent years that an entire industry has sprung up to provide solutions. Nonetheless, marketers continue to name email as one of their top strategies for reaching both B2B and B2C buyers.
Email Opens, Clicks, and CTOR
- Marketing emails monitored by GetResponse had a 22.15% open rate, and a 3.43% CTR in 2019. (GetResponse data analysis, 2019)
- Campaign Monitor’s reports open rates of 17.8%, and CTRs of 2.6%. (Campaign Monitor data analysis, 2020)
- Mailchimp’s average open rate across all industries in 2019 was 21.33% and the average CTR was 2.62%. (Mailchimp data analysis, 2019)
- The global average click-to-open-rate (CTOR) for marketing emails across industries was 15.49%, according to GetResponse. (GetResponse data analysis, 2019)
- The CTOR for marketing emails was 14.3%, according to Campaign Monitor’s analysis. (Campaign Monitor data analysis, 2020)
What Kinds of Emails Get Opened?
- Email users open just 57% of their personal emails and 80% of their work emails. (Adobe survey, 2019)
- Yesware reports that emails had an average open rate of 51.9%, but those with subject lines of between 1 and 5 words beat this average. (Yesware data analysis, 2019)
- ESP clients who identified as religious organizations had the highest open rate at 28.43% and had a CTR of 8.88%. (Constant Contact data analysis, 2020)
- Businesses in the technology industry had the lowest open rates at 9.65%, but the lowest click through rates were among salons and spas at 2.27% in Q1 of 2020. (Constant Contact data analysis, 2020)
- Transactional emails sent in 2018 had an approximately 20% higher engagement rate than non-transactional emails. (Acoustic data analysis, 2019)
- The open rate for triggered emails was 65.7% higher than the open rate for business as usual (BAU) emails. Triggered emails’ CTRs were 7.5% compared to 2.9% for BAU emails. (Epsilon data analysis, 2019)
Lead Generation Statistics
What kind of lead generation strategies are marketers employing? Data, technology and automation are all part of the mix. But content continues to play a crucial role as many consumers and business purchasers do their own homework online before contacting a seller.
B2B Lead Generation Strategies
- 73% of B2B buyers say they typically consume between three and seven pieces of content before speaking with a salesperson. (Demand Gen Report survey, 2019)
- Case studies (47%) and webinars (39%) as the two types of content that most influenced B2B purchasers’ decisions. (Demand Gen Report survey, 2019)
- 56% of demand generation professionals say that email was their top tactic for driving leads into their pipeline. Demand Gen Report survey, 2020)
- Businesses in the technology industry had the lowest open rates at 9.65%, but the lowest click through rates were among salons and spas at 2.27% in Q1 of 2020. (Constant Contact data analysis, 2020)
- 60% of marketing professionals say that personalization is their primary strategy for generating high quality leads. 57% believe a focus on improving their content and engagement rates is the key to success. (Ascend2 survey, 2019)
Costs and Conversions
- For both B2B and B2C digital subscription services, customer acquisition costs rose by approximately 50% between 2014 and 2019. (Profitwell, 2019)
- Paid search had the highest conversion rate at 2.9% for ecommerce retailers. The conversion rate for organic search leads was 2.8%. Referrals converted at a rate of 2.6%, email at 2.3% and social 1%. (Retail Touchpoints data analysis, 2019)
Is Social Media an Effective Lead Generation Channel?
- 64% of marketers planned to include social media in their lead generation strategy in 2019. (Social Media Today survey, 2019)
- 60% of web traffic referrals come from Google. Second place Facebook was responsible for 5.1% of referral traffic and YouTube, in third place, for 3.9%. (Sparktoro data analysis, 2019)
- Facebook delivers 65.36% of all social media traffic to websites while Instagram drives less than 1%. (GrowthBadger data analysis, 2019)
- 82% of marketers said that Facebook was the best social media platform for lead generation. 48% favor LinkedIn for lead generation. (Social Media Today survey, 2019)
Advertising Statistics
Advertising remains an essential component of many brands’ marketing strategies. But consumer pushback is a challenge. Are marketers still investing in paid? Yes.
How Much Are Brands Spending on Digital Advertising?
- U.S. local businesses’ spending on mobile and online advertising in 2020 was expected to be 28.2% of total budgets. Offline channels, direct mail (25%) and local video (19.9%), still take a large cut of local businesses’ budgets. (BIA Advisory Services forecast, 2019)
- Ad spending among large U.S. and U.K. brands (those with over $500 million in annual revenue) averaged 10.5% of total company revenue in 2019. Approximately 61% of CMOs expected to increase their ad budgets in 2020. (Gartner survey, 2019)
- U.S. companies expected to budget 8.6% of company revenue for marketing in 2020. (Deloitte survey, 2020)
- As a percentage of their total marketing budgets, brands with annual revenues of $500 million or more spent 15.5% on digital and search ads compared to 14.7% on television and offline media in 2019. (Gartner survey, 2019)
- Top U.S. companies planned to increase digital marketing spend by 13% and decrease traditional advertising spend by 0.4% in 2020. (Deloitte survey, 2020)
Consumer Sentiment Toward Paid Ads
- 74% of consumers use at least 1 advertising avoidance strategy. Those strategies include ad blocking (48%), changed media habits (47%), methods to completely avoid ads (39%) and paying for ad-free services such as streaming (38%). (Edelman survey, 2019)
- 77% of consumers don’t trust ads on social media. 52% of consumers distrust shopping recommendations or ads delivered via digital platforms such as smartphones, wearable devices, and chat apps. (Oracle survey, 2019)
- 66.7% of consumers say autoplay video ads with sound are the most annoying type of ad. 55% name autoplay videos without sound as their least favorite. (eMarketer/Bizrate survey, 2019)
- 42% of consumers dislike stalker ads, those that surface based on their online search history. eMarketer/Bizrate survey, 2019)
Marketing Technology Statistics
Technology and digital marketing are a natural match. Both consumers and marketers benefit from innovations that automate tasks and streamline data gathering. Here are few stats about how technology has and is influencing digital marketing.
How Marketers Are Using Technology
- 63.3% of all websites which use a content management system (CMS) use WordPress. In second place, Joomla is used by 4.2% of CMS-powered websites. (W3Techs data analysis, 2020)
- 52% of marketers used attribution reporting to track the impact and ROI of their efforts in 2019. (Hubspot survey, 2019)
- 45% of marketers used bots on their website in 2019. 16.5% marketers who were not using bots planned to add them in 2020. (Hubspot survey, 2019)
- 31% of companies and agencies use an email service provider (ESP) for marketing. 21% use marketing automation software. 34% of businesses used both an ESP and marketing automation software. (Act-On survey, 2019)
- Sending emails was the most common reason for using marketing automation (86% of companies and 82% of agencies). CRM integration was the second most common purpose (57% of companies and 62% of agencies). (Act-On survey, 2019)
How Consumers Are Using Technology
- 25% of consumers planned to use their smartphones for holiday shopping in 2019. (NPD survey, 2019)
- Google Maps is the number 4 smartphone app among U.S. users, ranking just below YouTube, Facebook and Google. (eMarketer/Comscore data analysis, 2019)
- 69% of global consumers used a digital assistant and 45% owned a smart speaker in 2018 or 2019. (Microsoft survey, 2019)
- 57% of people with a digital assistant prefer to use voice commands to make requests and queries. (Microsoft survey, 2019)
- 90% of the total time consumers spend using their mobile devices is spent using apps, including social media apps. (We are social aggregated surveys and data analysis, 2020)
- 65% of consumers between the ages of 18 and 37 want personalization technology to offer them personal recommendations, 61% want curated selections, and 60% want recommendations based on their existing wardrobe. (BRP Consulting survey, 2019)
There you have it — the most recent and updated list of digital marketing statistics in the last two years.
What was the most surprising to you? Let us know in the comments below!